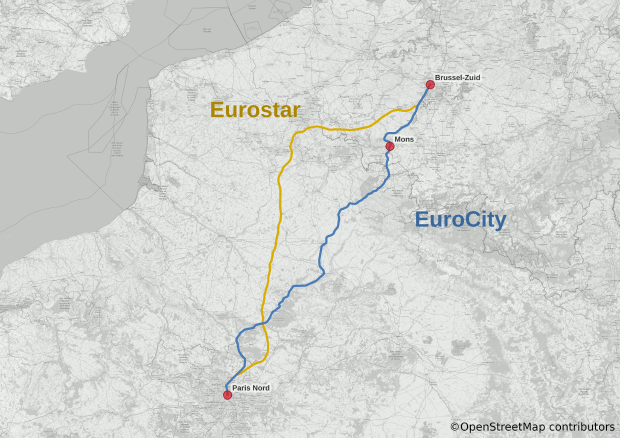
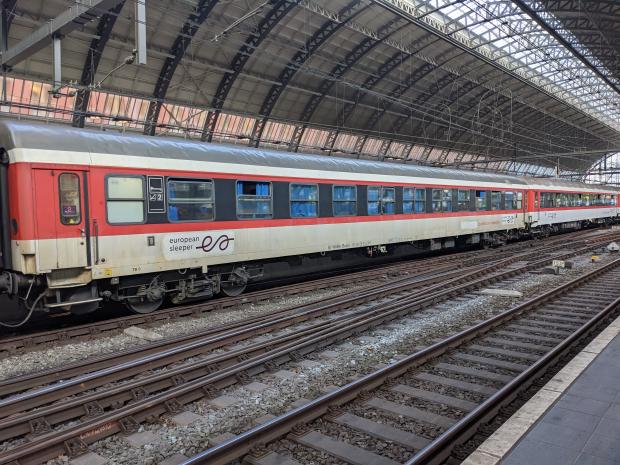
Traveling by train across countries has been getting a lot easier, especially within central Europe where everything is a bit closer together.1 We’ve got the Thalys (now Eurostar) doing 12 trips a day from Amsterdam to Paris through Brussels, and the actual Eurostar doing 4 trips a day from Amsterdam to London, via Brussels and Lille. There are also other relatively good frequency and direct services to larger cities at high speed. Similarly, for slower travelers at longer distances, there is the European Sleeper operating night trains between Belgium, the Netherlands, Germany, and most recently the Czech Republic three times a week. The travel times here are longer than on a high-speed connection but you’re passing through many more cities along the way. The general idea is also that you’d have a good night’s rest throughout the journey. In this same category, OBB operates its nightjet service to many locations, like Zurich to Amsterdam, via Cologne and Dusseldorf, or from Munich to Rome.
Read more...