Creating rail maps with Cytoscape.js
Posted: | Tags: status transport projectSince I’ve begun blogging semi-regularly I’ve learned that having visuals helps especially when it comes to talking about different locations and their relation to each other. It can be difficult to judge the space and distance between two streets in a city or two cities in a country without some familiarity with the location. A problem I come across frequently when reading transit-related articles and blogs. It’s for this reason I try to include maps in my transport-related posts from very early on.
In the past, I’ve used uMap to pin point all the level crossings along the tracks to Maliebaan, and to visualise the tram network in Berlin and it’s the divide in relation to the Berlin wall. uMap is great since it’s interactive, provides the creator with an easy-to-use interface, and supports importing standard formats like geoJSON. When talking about network coverage with the bus and tram network in Utrecht I tried QGIS for the first time using OpenStreetMap data. Creating those isochrone-type plots doesn’t seem to be possible in uMap, to my knowledge, leading me to use the exported image from QGIS instead. It’s a fantastic tool to learn to use, I can see myself cleaning up map data in QGIS for use in uMap in the future.
Early on, before all of those tools I discovered Cytoscape.js. A graph library written in JavaScript with both an application and developer library used by, apparently, a lot of big names. My mind immediately went to whether it was possible to adapt to graph rail and metro maps. Of course, it’s possible. One of the examples shows Tokyo railway with the ability to set a start and end station which then highlights the route. I ended up building some simple tools and helper scripts to create my maps which I used in graphing signaling on the Elizabeth line and to plot the Amsterdam metro. Both of those maps were not interactive like the Tokyo example but I simply wanted to have a visual representation to convey a message.
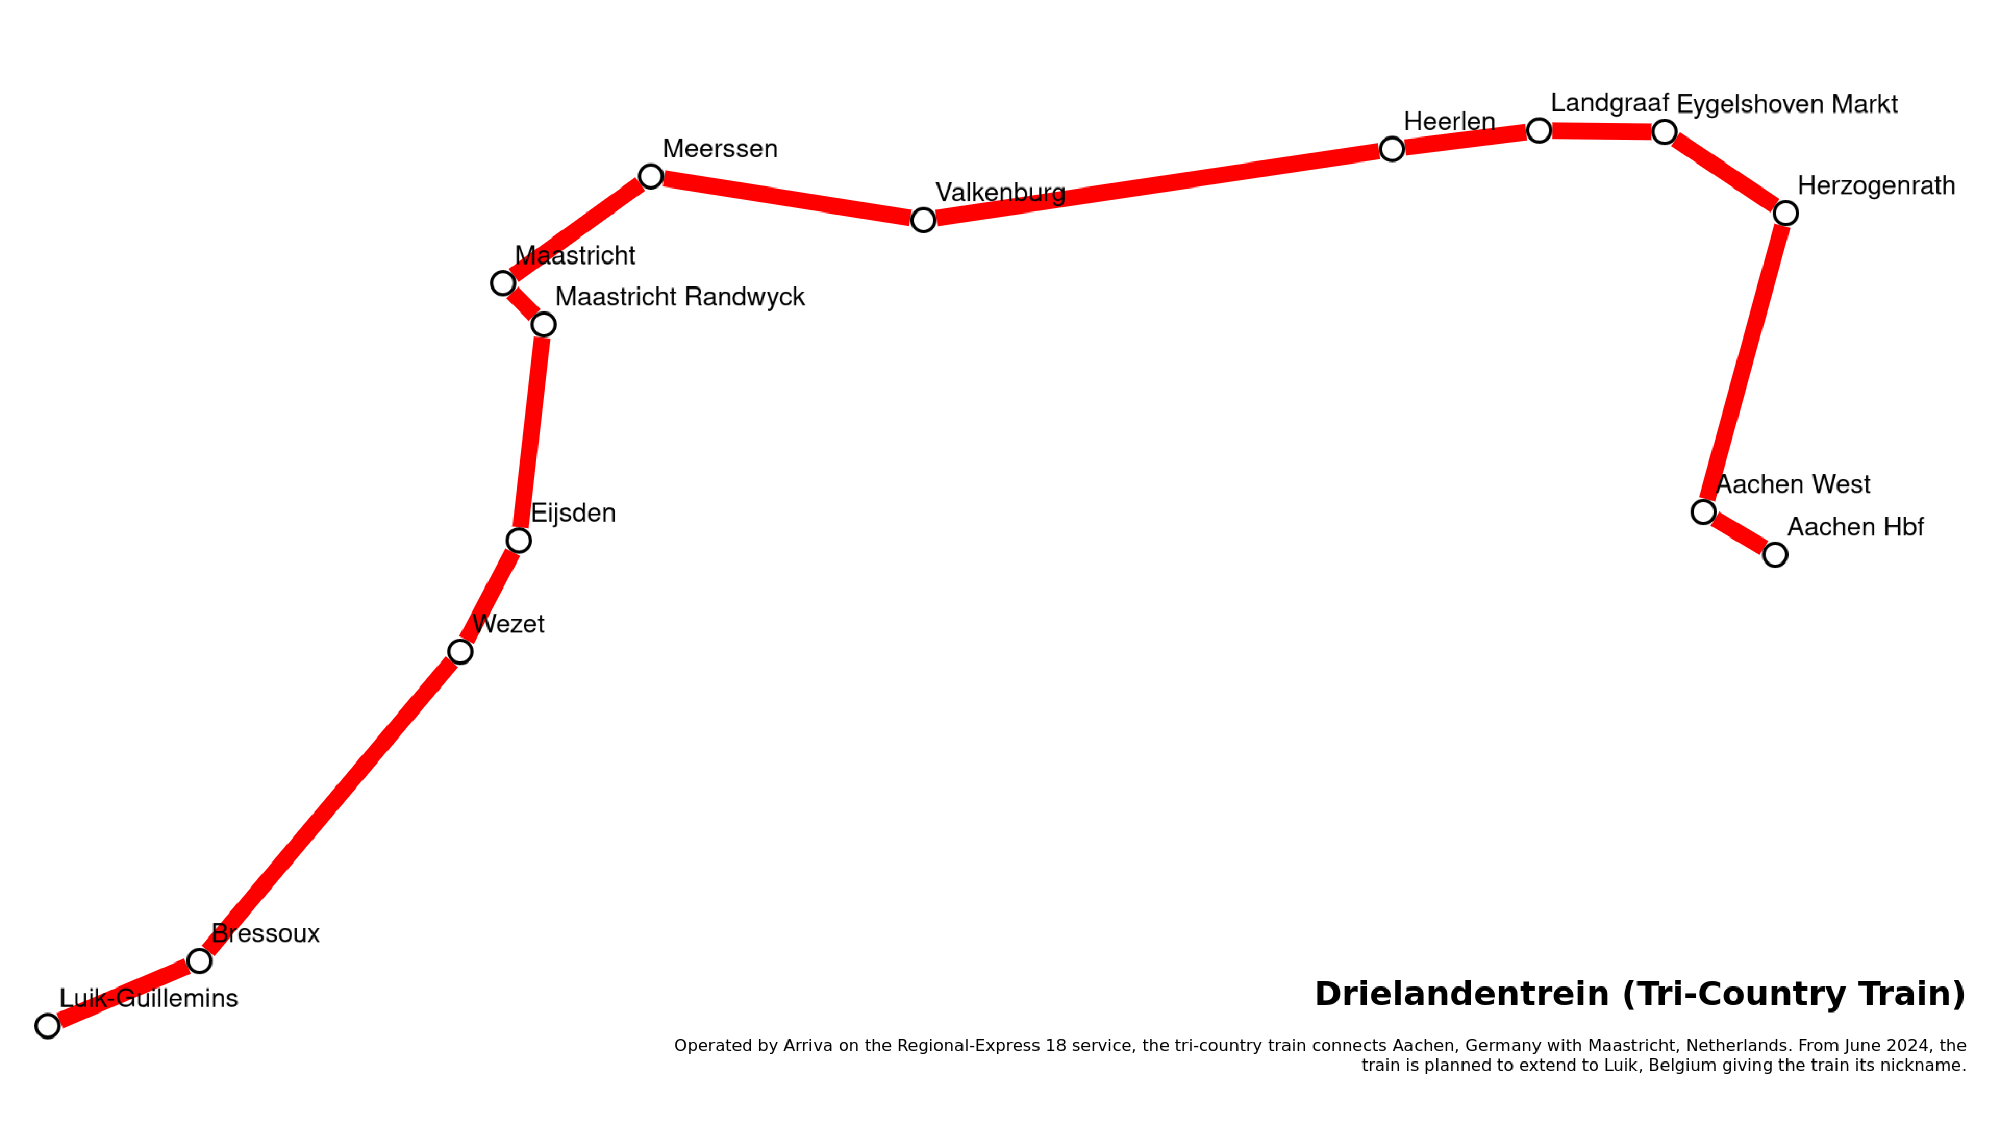
After many months of sitting on those files, I put together a quick-start guide using the scripts I created to make your own Cytoscape map. By the end you will have created the above plot of the “Drielandentrein”1. Nominatim is used in places to get coordinates based on station names2. The repository is still very much in its infancy but I wanted to properly document the flow for others and my future self. Publishing this also forced me to clean up the code a bit so others could reproduce the same results.
Feel free to browse the repository and reach out over GitHub or Mastodon if you have any questions, issues or comments.
A post about the tri-country train will come soon 🙂 ↩︎
I’ve previously covered how you can use the Nominatim to geocode names. ↩︎